


Headlines are grim for sustainable investments. But headlines are frequently misleading. To paraphrase Mark Twain, the figures suggest reports of its death may be somewhat premature.
First of all, though, a caveat: how one defines “sustainable” greatly affects the calculation, as does the market on which one focuses. Here I’m focusing on the UK market, with a rather restricted definition of “sustainable”: all SFDR Article 9 funds plus those containing indicative sustainable keywords in the name. This gives a narrower universe than, for instance, including all integration-based strategies.
See also: Sustainable global equity through the looking glass
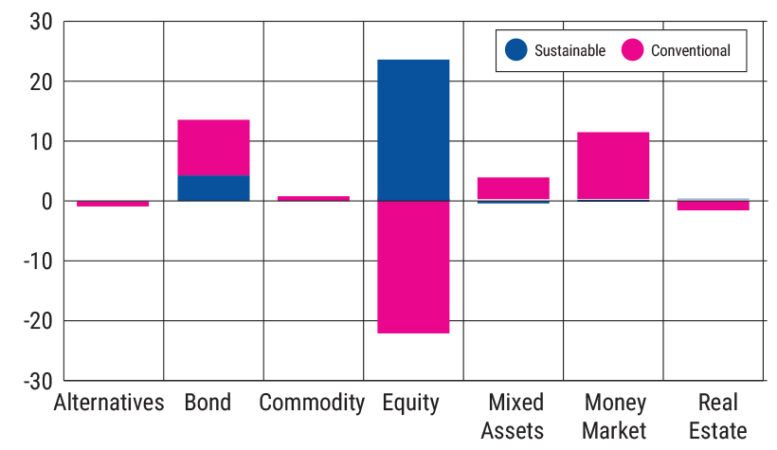
What does the data show? Equities finished 2024 as the most successful sustainable asset class, netting £23.61bn, while their conventional equivalents shed £22.39bn. In percentage terms, sustainable equities represented 85% of net total flows for the year. Sustainable bonds came in a distant second, with inflows of £4.27bn, as their conventional peers attracted £9.29bn (chart 1).
Chart 1: Asset class flows, ESG v conventional, FY 2024 (£bn)
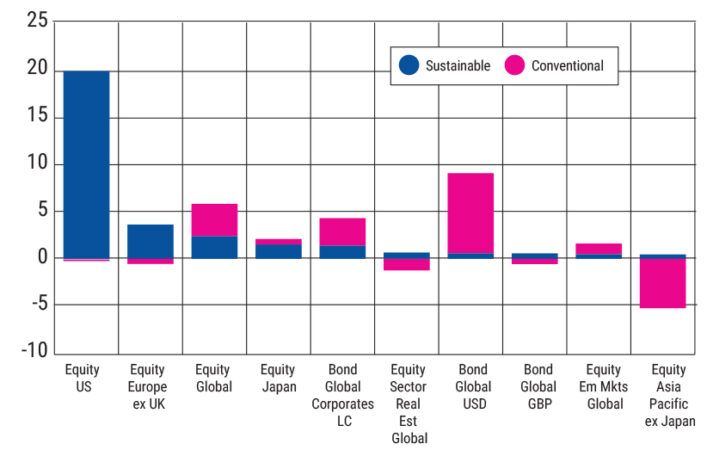
Managers of sustainable US equity funds have been filling their boots, as the classification netted £19.54bn (chart 2): 82% of the total flow went to sustainable equities, and 71% of the overall flow to sustainable assets. Given the performance of US large caps over the year, that’s not such a surprise. What is more surprising is that about £18bn of the flows to Equity US has gone to active managers. Why this should be in the world’s best researched and most liquid market isn’t altogether clear, given these characteristics should militate more in favour of passive strategies.
Chart 2: Top-selling sustainable fund classifications versus conventional equivalents, FY 2024 (£bn)
One thing this active tilt isn’t is a back-door way to reduce concentration risk. Over the full year £14.6bn of the £23.61bn netted by sustainable equity funds fell to just four funds—all equity US. Focusing on the two equity US funds that netted the most in Q4, exposure to the magnificent seven stocks run at 34.12% and 33.28%: broadly in line to slightly ahead of the Mag Seven’s S&P 500 weighting. This begs questions, both regarding concentration risk and ESG criteria. But this is a rabbit hole to a labyrinthine warren into which we shall not descend at this time. Suffice it to say that sector weightings between these funds and a plain-vanilla S&P tracker, while different, are not that different. This is not too surprising when ESG fund mandates are often specified as being less carbon intensive (often without specifying how much less, or whether this is Scope 1, 2, or 3) than the index.
See also: Can the magnificent seven ever be considered a ‘responsible’ investment?
That’s a rather minimalist positioning, and in line with the current pension scheme regulatory requirements, where they must consider how ESG and wider sustainability factors may affect the financial performance of their investments. The nature of the flows to these funds would suggest this is the source of the cash: large allocations by large investors. The implication being, despite the increased role of the retail market in sustainable investing, it’s still very much a market characterised by institutional investors.
Rewinding the clock three or four years, and the change in mood music is palpable. Then, no wholesale or retail investment event was complete without a substantial nod to sustainability, down to the plant-based-only buffet. That’s been very much dialled down and an indication of the scaling back of retail interest may be gauged from the squeeze in sustainable mixed-assets funds, a popular retail area where sustainable flows peaked in 2021 and have been negative for the past two years (chart 3).
Chart 3: Sustainable UK flows by asset class, FY 2024 (£bn)
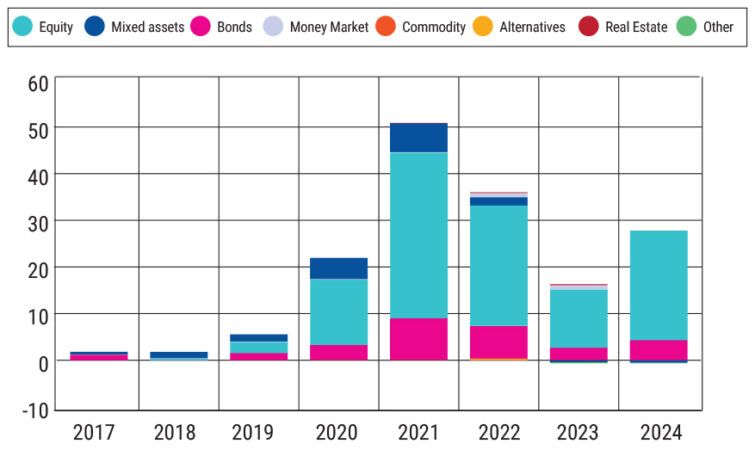
Aggregate sustainable flows peaked in 2021, trended down, and headed up again last year. It would be rash to predict a turning of the corner, but what might keep the trend positive? There are any number of factors, but here’s a couple for consideration. First, net UK fund flows were negative in 2022 and 2023. Sustainable investments are not immune from this. Second, the shift from growth to value at the end of Covid took a bite out of sustainable fund returns, as did the elevated rate environment from 2022. The promise of enhanced returns from sustainable investments turned out to be built on shaky foundations, and investors responded accordingly.
The ensuing shakeout has reset expectations. The data suggests that institutional investors continue deploying capital to relatively conservative ESG strategies, while the retail/wholesale markets have taken more of a lasting hit. That would suggest a longer path back for this market.